
Feeling overwhelmed by numbers?
But what if you could turn those numbers into something more visual, interactive, and easy to digest? Welcome to Zoho Cliq’s Widgets—a smarter way to view, manage, and act on your data.
Clean, clutter-free dashboards
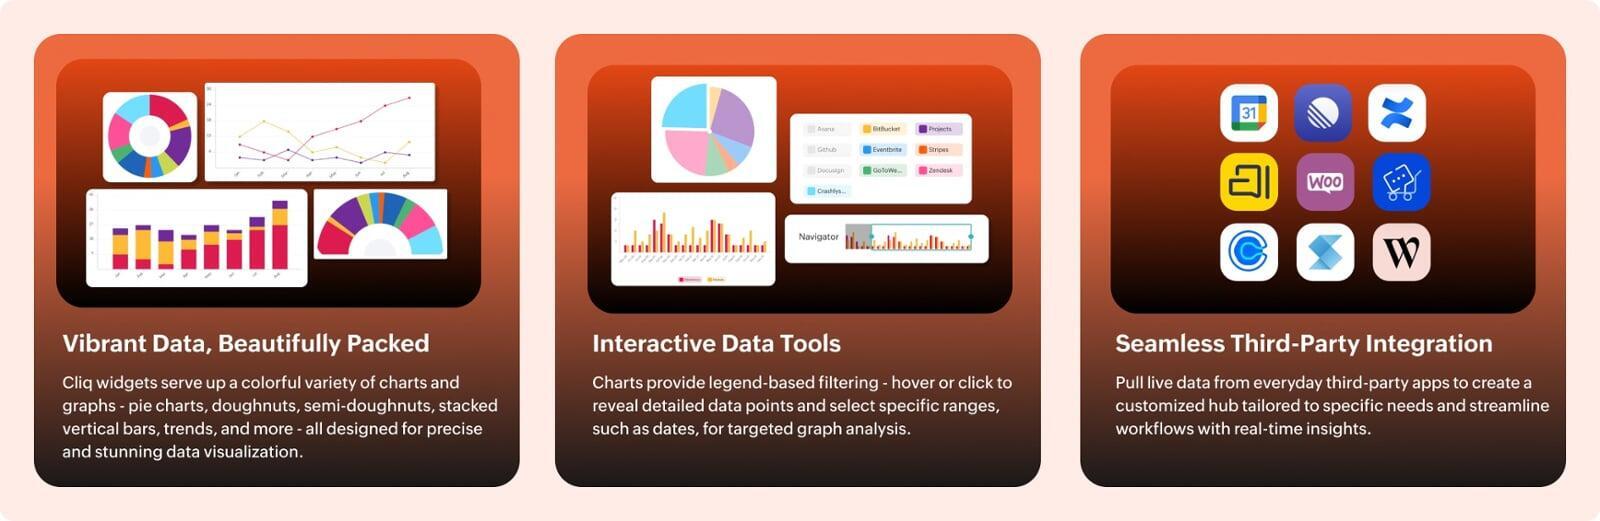
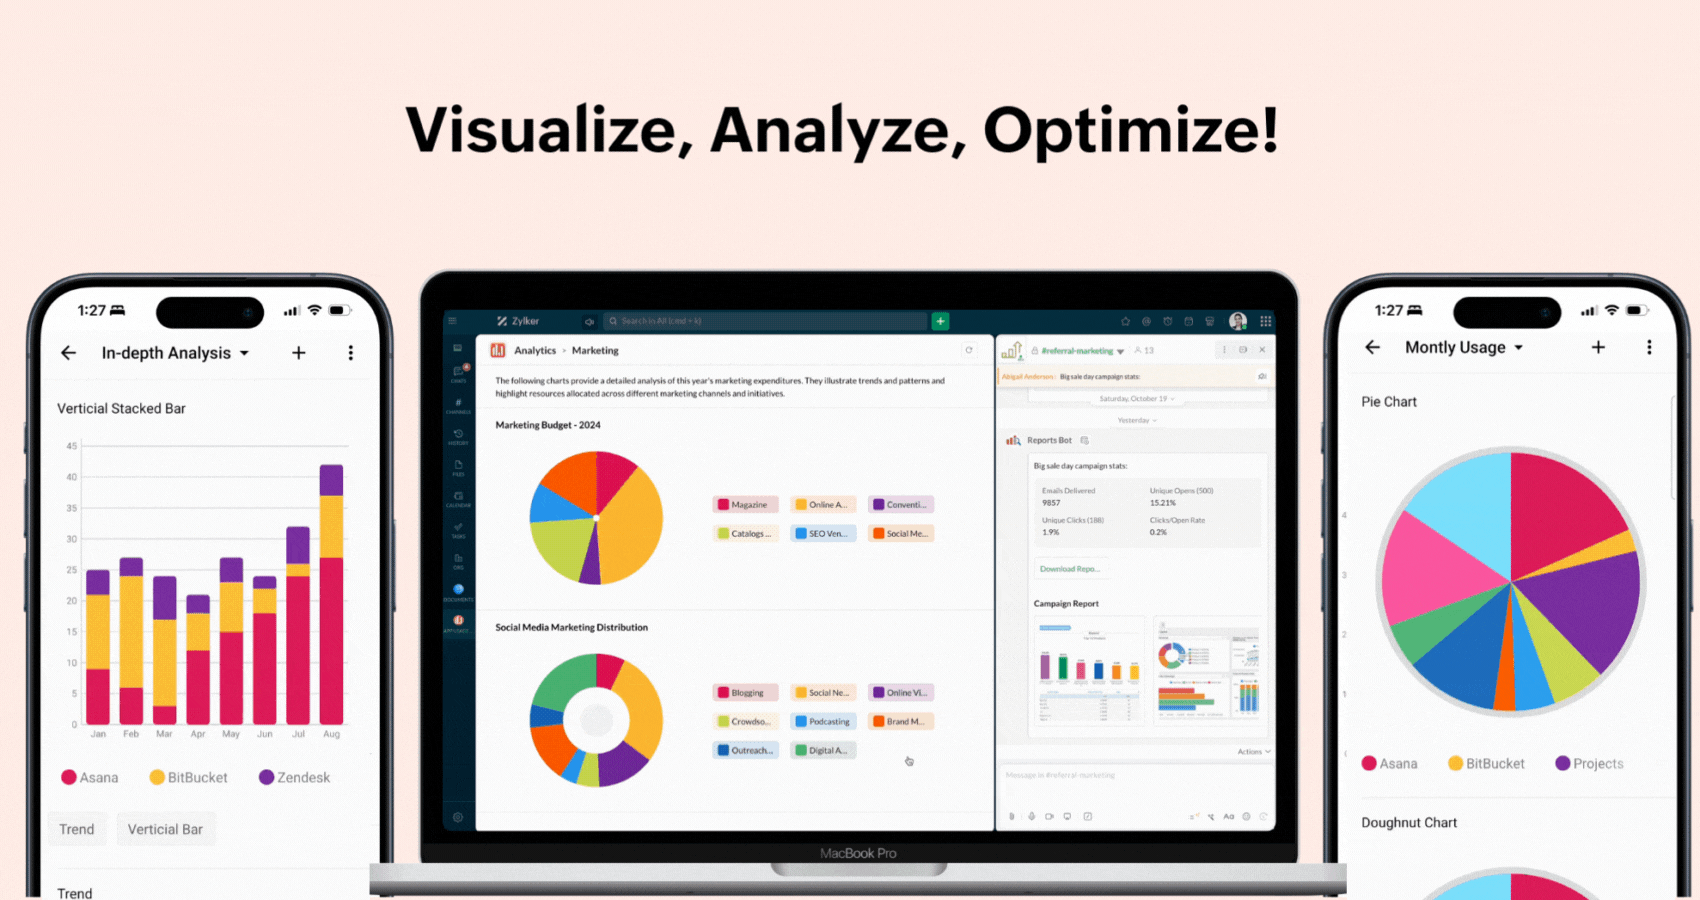
Widgets are the foundation of a personalized dashboard experience in Zoho Cliq. You can bring real-time data from your favorite third-party apps and design a workspace that highlights exactly what’s important to you. These widgets aren’t just functional—they’re visually powerful, offering a variety of display options like bar charts, pie graphs, line trends, and more that breathe life into raw figures.
Smarter data management with Zoho Cliq Widgets
Let’s talk KPIs—those key performance indicators that help measure the impact of your strategies. Whether you’re tracking customer satisfaction, monitoring site visits, or evaluating task completion rates, Zoho Cliq widgets allow you to display your metrics in highly customizable formats. Use progress gauges for sales goals, pie charts for team productivity, or add informative text blocks, cards, and images to add context and clarity.
![]()
Real-world use cases: Widgets in action

Data meets real-time collaboration
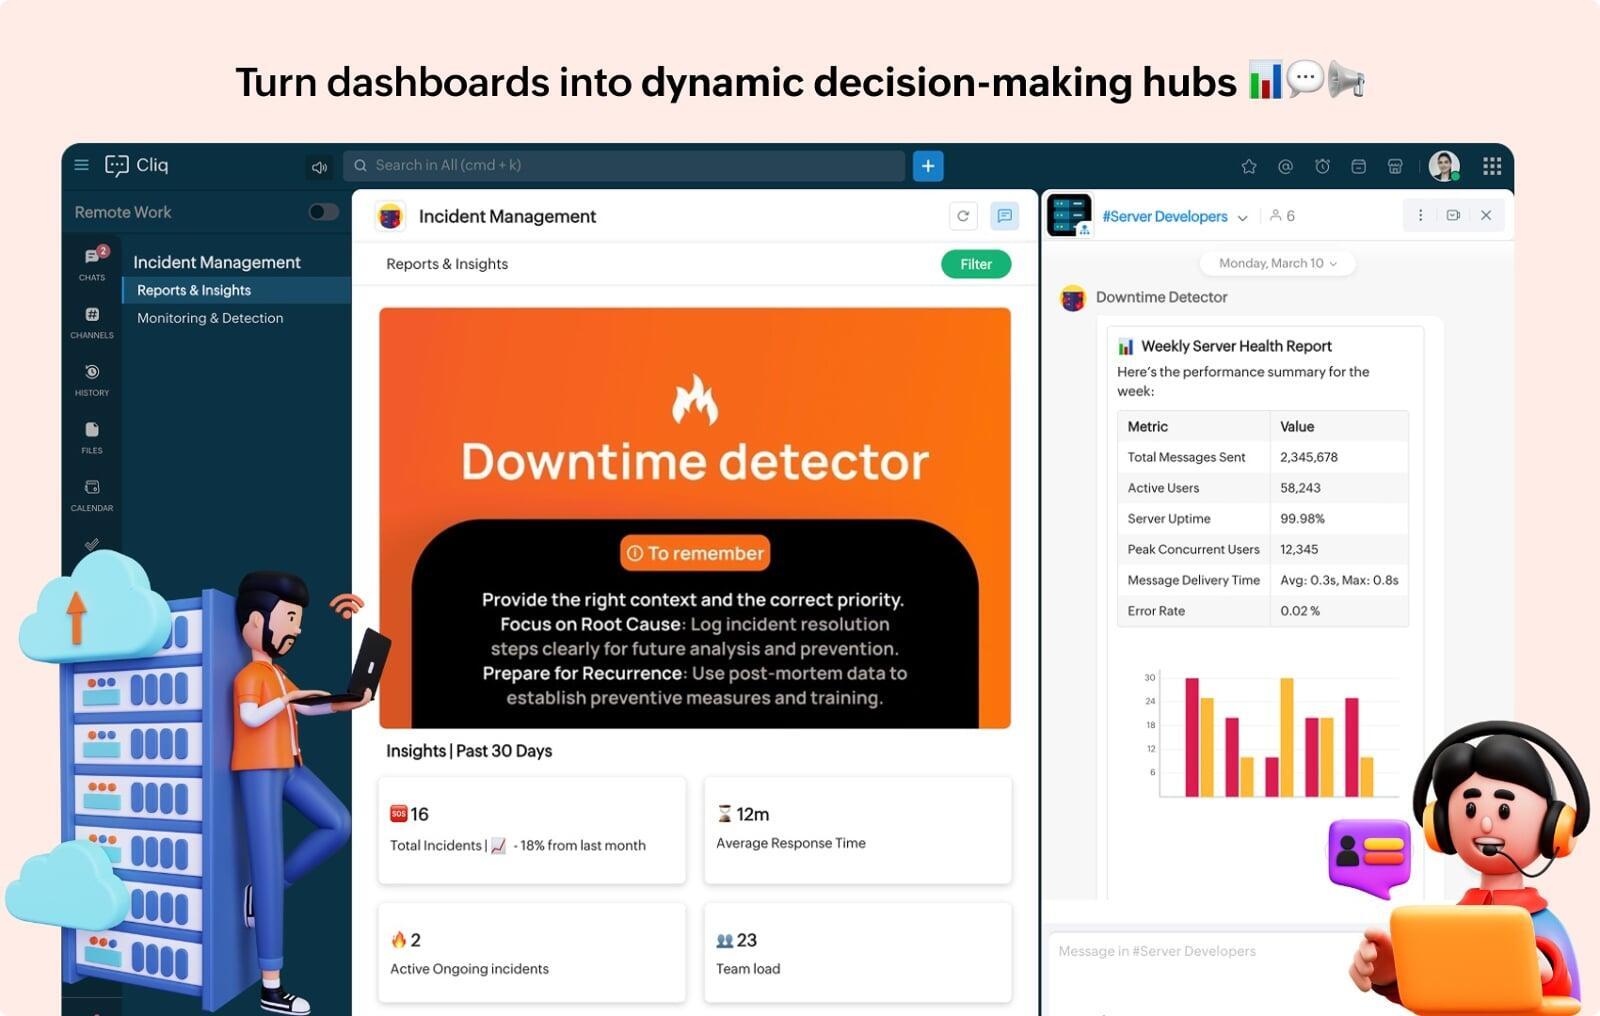
What sets Zoho Cliq apart is the seamless blend of data and dialogue. With widgets, you’re not just monitoring metrics—you’re having conversations around them. Open a chat or hop on a call directly from within a widget. Whether it’s brainstorming your next campaign or refining a strategy, discussions happen alongside the data for faster decisions.
Noticed a sudden dip in user engagement? Start a discussion right next to the widget to address it with your team instantly.
Automate important updates with bots or schedulers to push key insights into channels. You can also stream relevant industry news directly into Cliq, enabling marketing and strategy teams to respond in real-time.
Turn data into decisions
With Zoho Cliq’s widgets, your dashboard becomes more than just a data display—it’s an interactive command center for your organization. Instead of waiting for reports or switching between tools, you get instant access to meaningful insights, right where you work.
No more spreadsheet fatigue—just streamlined data, smarter collaboration, and decisions made with clarity.
Make your dashboard work for you—start visualizing smarter with Zoho Cliq.
For more details visit pfc-group.com.